See how the rest of the world lives, organized by income | Anna Rosling Rönnlund
TED2 HN recommenders · recommended in 2 months, 2018–2023
talk · general · evergreen · 2018–2023 on HN
Anna Rosling Rönnlund presents Dollar Street, a project photographing homes in dozens of countries, from stoves to beds to toilets, and sorting them by income. She shows how data visualization can change how we see the world.
HN recommends it as an insightful, perspective-giving look at how people live across income levels, useful as a counter to pessimism.
Up next
 4 mo on HN
MyHouse.WAD - Inside Doom's Most Terrifying Mod
Power Pak
4 HN recommender · 2023–2026
 3 mo on HN
Pentagon Wars - Bradley Fighting Vehicle Evolution
66NOVA66
3 HN recommender · 2014–2024
 2 mo on HN
MAKRO | XLOOKUP: META BREAKER? | Microsoft Excel Stream Highlights 10/19
KRAZAM
2 HN recommender · 2020–2026
 12 mo on HN
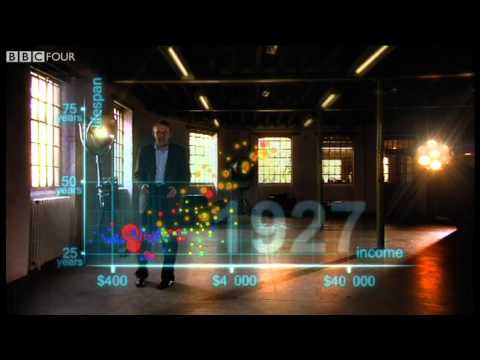
Hans Rosling's 200 Countries, 200 Years, 4 Minutes - The Joy of Stats - BBC
BBC
10 HN recommender · 2010–2023
 3 mo on HN
New Earthships capture more energy, water & food at lower cost
Kirsten Dirksen
3 HN recommender · 2020–2026
 5 mo on HN
Why Louisiana Stays Poor
Together Louisiana
6 HN recommender · 2018–2024
 4 mo on HN
The Ranks of Global Billionaires: Not All Billionaires Are Made Equal
Economics Explained
4 HN recommender · 2020–2022
 14 mo on HN
A Better Default Colormap for Matplotlib | SciPy 2015 | Nathaniel Smith and Stéfan van der Walt
Enthought
15 HN recommender · 2015–2026
 11 mo on HN
DON'T PANIC — Hans Rosling showing the facts about population
Gapminder Foundation
8 HN recommender · 2017–2021
 8 mo on HN
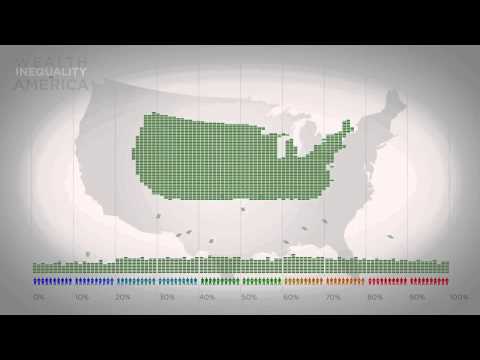
Wealth Inequality in America
politizane
8 HN recommender · 2013–2025
 7 mo on HN
Animations of unseeable biology | Drew Berry | TED
TED
7 HN recommender · 2017–2025
 7 mo on HN
Immigration, World Poverty and Gumballs
NumbersUSA
7 HN recommender · 2013–2024
3 comments from Hacker News
This is just personal but anytime I feel similar to the OP, I watch something by Hans Rosling [1] or Anna Rosling [2]. Although 10 and 5 years old respectively, I feel the general sentiment is still true - that human progress is slow, in the background and might be ebbing and flowing in your specific sub-population. And when compared to the present, media narrative driven present its hard to see the improvements happening across the global population. It helps me put stuff in perspective - of course mileage may var (and maybe it's just helping me delude myself into getting out a funk but it works!). [1] Hans Rosling's 200 Countries, 200 Years, 4 Minutes - link [2] See how the rest of the world lives, organized by income - Anna Rosling Rönnlund ▶ this video
This TED talk [1] about seeing how the rest of the world lives was very insightful for me. Anna Rosling Rönnlund (Hans Rosling's daughter in law) went to 264 homes of varying income levels and took photos of beds, stoves, toys and other standardized goods. When sorting by income level, you can spot globalized trends by income regardless of nationality. [1] ▶ this video
From link > We want to show how people really live. It seemed natural to use photos as data so people can see for themselves what life looks like on different income levels. Dollar Street lets you visit many, many homes all over the world. Without travelling ... A team of photographers have documented over 264 homes in 50 countries so far, and the list is growing. In each home the photographer spends a day taking photos of up to 135 objects, like the family’s toothbrushes or favorite pair of shoes. All photos are then tagged (household function, family name and income) ... Gapminder is an independent Swedish foundation with no political, religious or economic affiliations. Video (2018): ▶ this video