Why do prime numbers make these spirals? | Dirichlet’s theorem and pi approximations
3Blue1Brown7 HN recommenders · recommended in 5 months, 2019–2024
explainer · intermediate · evergreen · 2019–2024 on HN
3Blue1Brown explains why plotting primes in polar coordinates produces spiral patterns, using modular arithmetic, Dirichlet's theorem and rational approximations of pi.
Frequently recommended as the clearest explanation of prime spirals and the Ulam spiral.
Up next
 7 mo on HN
The Banach–Tarski Paradox
Vsauce
6 HN recommender · 2015–2024
 2 mo on HN
This high-speed rail project is a warning for the US
Vox
2 HN recommender · 2022–2023
 4 mo on HN
Animated Voting Methods
Unify The Vote
3 HN recommender · 2018–2022
 4 mo on HN
How our voting system (and IRV) betrays your favourite candidate
The Center for Election Science
5 HN recommender · 2014–2023
 3 mo on HN
What P vs NP is actually about
Polylog
4 HN recommender · 2024–2026
 9 mo on HN
Harder Drive: Hard drives we didn't want or need
suckerpinch
12 HN recommender · 2022–2025
 2 mo on HN
Professional SMT Soldering: Hand Soldering Techniques - Surface Mount
John Gammell
2 HN recommender · 2016–2023
 2 mo on HN
Bayes theorem, the geometry of changing beliefs
3Blue1Brown
2 HN recommender · 2022–2024
 18 mo on HN
Vectors | Chapter 1, Essence of linear algebra
3Blue1Brown
17 HN recommender · 2018–2026
 15 mo on HN
But what is the Fourier Transform? A visual introduction.
3Blue1Brown
16 HN recommender · 2018–2025
 14 mo on HN
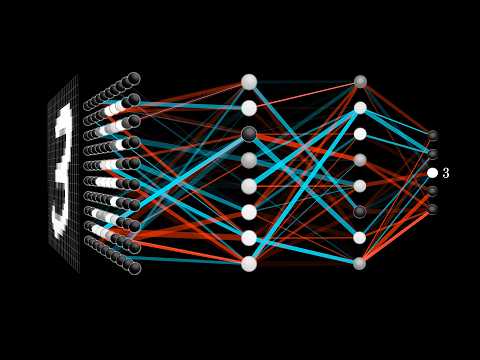
But what is a neural network? | Deep learning chapter 1
3Blue1Brown
16 HN recommender · 2017–2025
 13 mo on HN
The Beauty of Bézier Curves
Freya Holmér
16 HN recommender · 2021–2026
12 comments from Hacker News
Here is one of the most enlightening explanations for these kinds of spirals I have seen by 3blue1brown: ▶ this video Note that the setup is slightly different,since in that video they plot numbers along their polar coordinates. The results are very similar, since both create spirals with predictable angular offsets.
Numberphile[1] and 3b1b[2] (with a particularly good explanation of why it happens) have done good videos on the prime spiral. [1] link [2] ▶ this video
> But after a fairly small size, there's almost no utility in visualizing graphs. I want to stress this point and go a bit further. It can be worse as people have pareidolia[0], a tendency to see order in disorder. Like how you see familiar shapes in the clouds. There is a danger in that with large visualizations such as these that instead of conveying useful information, you counterproductively convince someone that something that isn't true is! Here's a relevant 3B1B video where this is kinda discussed. There is real meaning but the point is that it is also easy to be convinced of things that aren't true[1]. In fact, Grant's teaching style is so good you might even convince yourself of the thing he is disproving as he is revealing how we are tricked by the visualization. Remember what the original SO person latched onto. I think it's important to recognize that visualization is a nontrivial exercise. Grant makes an important point at the end, restating how the visualization was an artifact and how if you dig deep enough into an arbitrary question, you _can_ find value. Because at the end of the day, there are rules to these things. The same is true about graphs. There will always be value in the graph, but the point of graphing is to highlight the concepts that we want to convey. In a way, many people interpret what graphs are doing and why we use them backwards. You don't create visualizations to then draw value from them, but rather your plots are a mathematical analysis
3B1B has a semi related video on how working with prime numbers can help you see properties that are also found in composite numbers, since the sequence of primes overlaps with many other sequences. ▶ this video
For IMO a more meaningful phenomenon, this video by 3Blue1Brown explains why primes plotted as (p, p) in polar coordinates produce interesting patterns. ▶ this video
In this vein, I really enjoyed 1brown3blue breaking down why prime numbers form patterns when graphed in polar coordinates. ▶ this video
The first time I saw these, I thought it hinted at some deep insight into the nature of primes. However, after watching the following video, I think it just says something about modular arithmetic and rational approximations of 2 Pi. ▶ this video The video is only about Archimedian spirals, but I suspect a similar analysis would apply to Ulam spirals too. We really like to find patterns.
Ulam Spiral (and see ref to Martin Gardner's famous SciAm article): link Why do prime numbers make these spirals? | Dirichlet’s theorem and pi approximations - 3Blue1Brown ▶ this video
I'm not really sure what to say to this, other than watch this video and apply similar thinking to this problem: ▶ this video The leaf structure itself doesn't really have anything to do with ZF set theory or Von Neumann ordinals, other than supplying the inspiration for the base structure. Same way prime numbers don't generate the spirals in the video, all numbers do. So leave the ordinals out of this, experiment with different tree construction methods and you might uncover something cool about trees (but not necessarily about set theory)
I guess the Ulam spiral is more an artefact of the cartesian plane than an "hidden pattern": ▶ this video
Warning: Bit of a 'Hitch hikers guide to the galaxy"/conway game of life yak shave for a reply. Nice start to providing a simple way to visually interact/experiment/manipulate different multiple Neural network concepts by loading/transforming any traditional code (working or not) & reshuffling/tesselating the structual representation of the code to generate a turing tape path via color execution paths. Switching to pi calculus could provide the theory to support coroutine/coprossing/ threading" multiple interacting tape paths/color combinations/path diffs/scaled recusion to perform assembly language instructions. Raster graphics without the yak ( link ) Feed back between tape & "traditional code" as neural network layer(s)! Flexiable code (via tessilations) without changing the actual imported source code! So, complete svg (tape interactions) web page as code source on how to interact with web page, ( link ) what's displayed/played, documentation & usage manual included within code structure! Unicode permits implied piping rich kern font without all the tech fluff. Unicode fails because allows infinate multics and is there for k&r incomplete. But, this approach is way more dimensional/colorful than unicode/tech stuff. ?? can one's code unintentially provide a wordle problem & solution in one package ?? ( link ) ?? turing complete fourier transforms link toolkit concepts: Neural networks / analog stuff : link perceptrons: link spreadsheets (: link (turing spreads
I've got Pi memorised more precisely than 355/113 as well for no good reason, and for engineering applications it doesn't serve any purpose. But the fraction is weirdly close and that's interesting for other (more academic) reasons, such as explaining why plotting primes in polar coordinates looks like a pattern: ▶ this video