Data visualization & information design Videos Recommended on Hacker News (44)
Data visualization & information design is one of the 150 topics Hacker News readers organize their video recommendations around. These 44 videos each earned real recommendations in real HN threads between 2010 and 2026 — 164 recommendations in total — and they're ranked by how many separate months the community kept coming back to them, not by view count.
Data visualization: charts, maps, infographics, Edward Tufte, Hans Rosling, interactive visualization, D3, time-lapse data art, visual explanations of data.
Why HN keeps sending people here — on A Better Default Colormap for Matplotlib | SciPy 2015 | Nathaniel Smith and Stéfan van der Walt: “This hilarious SciPy2015 talk[1] convinced me to switch to the Parula color scheme.” — an HN commenter, 2018.
Type
TalkLectureDocumentaryExplainerDemoTutorialInterviewCommentaryComedyMusicPodcastsNews & reportingCoursesFeatures
Evergreen only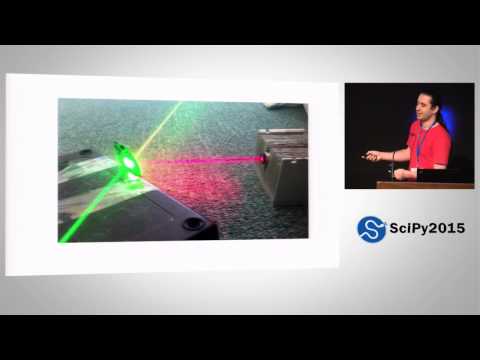 14 mo on HN
A Better Default Colormap for Matplotlib | SciPy 2015 | Nathaniel Smith and Stéfan van der Walt
 7 mo on HN
Animations of unseeable biology | Drew Berry | TED
 6 mo on HN
How not to be ignorant about the world | Hans and Ola Rosling
 5 mo on HN
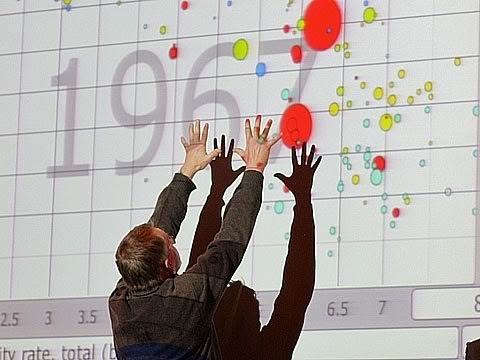
The best stats you've ever seen | Hans Rosling
 5 mo on HN
4 2 1 Christopher Domas The future of RE Dynamic Binary Visualization
 4 mo on HN
Religions and babies | Hans Rosling
 4 mo on HN
Bret Victor - Media for Thinking the Unthinkable
 3 mo on HN
REcon 2013 - The Future of RE : Dynamic Binary Visualization (Christopher Domas)
 3 mo on HN
Bret Victor - Drawing Dynamic Visualizations
 2 mo on HN
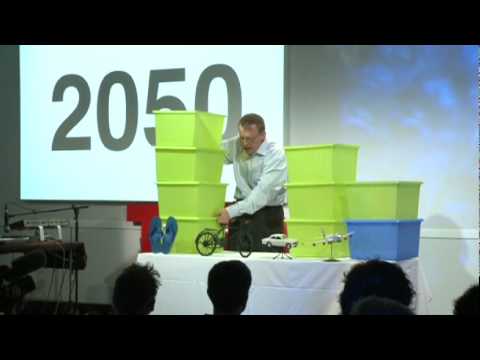
Hans Rosling: Global population growth, box by box
 2 mo on HN
See how the rest of the world lives, organized by income | Anna Rosling Rönnlund
 2 mo on HN
Is the world getting better or worse? A look at the numbers | Steven Pinker
 1 mo on HN
Visualizing Data Using t-SNE
 1 mo on HN
H3: Tiling the Earth with Hexagons
Also discussed on Hacker News (9)
Mentioned in HN threads about data visualization & information design, though never formally recommended:
The History of Europe: Every Year · The Tube Map nearly looked very different · Asteroid Discovery - 1970-2015 - 8K resolution · Gabbard Diagram for Low Earth Orbit 1959-2021 · The magic washing machine | Hans Rosling · Nuclear Detonation Timeline "1945-1998" · Most Popular Programming Languages 1965 - 2019 · ✖️Coronavirus TIMELINE · China - 3,000 Years of History in a Minute