Data visualization & information design Videos Recommended on Hacker News (53)
Data visualization & information design is one of the 150 topics Hacker News readers organize their video recommendations around. These 53 videos each earned real recommendations in real HN threads between 2010 and 2026 — 164 recommendations in total — and they're ranked by how many separate months the community kept coming back to them, not by view count.
Data visualization: charts, maps, infographics, Edward Tufte, Hans Rosling, interactive visualization, D3, time-lapse data art, visual explanations of data.
Why HN keeps sending people here — on A Better Default Colormap for Matplotlib | SciPy 2015 | Nathaniel Smith and Stéfan van der Walt: “This hilarious SciPy2015 talk[1] convinced me to switch to the Parula color scheme.” — an HN commenter, 2018.
Features
Evergreen only 14 mo on HN
A Better Default Colormap for Matplotlib | SciPy 2015 | Nathaniel Smith and Stéfan van der Walt
 12 mo on HN
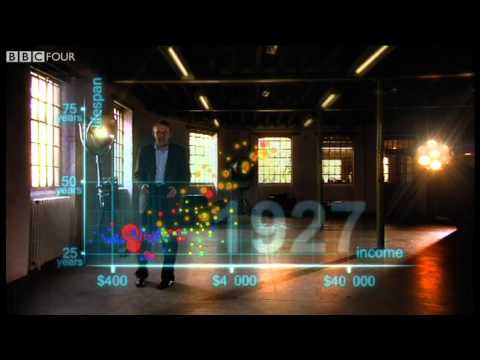
Hans Rosling's 200 Countries, 200 Years, 4 Minutes - The Joy of Stats - BBC
 11 mo on HN
DON'T PANIC — Hans Rosling showing the facts about population
 8 mo on HN
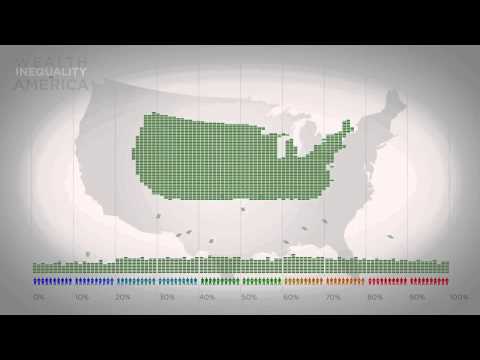
Wealth Inequality in America
 7 mo on HN
Animations of unseeable biology | Drew Berry | TED
 7 mo on HN
Immigration, World Poverty and Gumballs
 6 mo on HN
How not to be ignorant about the world | Hans and Ola Rosling
 5 mo on HN
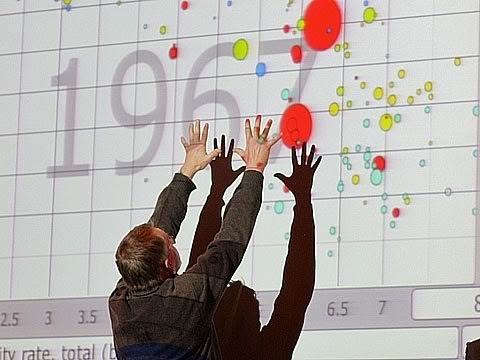
The best stats you've ever seen | Hans Rosling
 5 mo on HN
4 2 1 Christopher Domas The future of RE Dynamic Binary Visualization
 5 mo on HN
Simulating an epidemic
 5 mo on HN
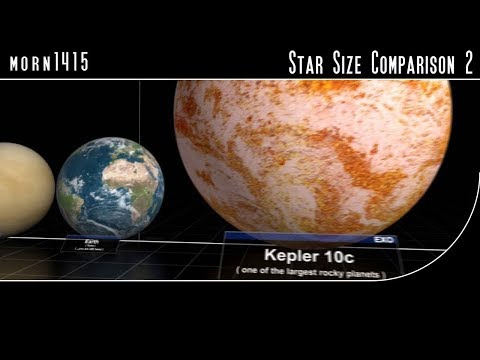
Star Size Comparison 2
 4 mo on HN
Animated Voting Methods
 4 mo on HN
Overpopulation – The Human Explosion Explained
 4 mo on HN
Religions and babies | Hans Rosling
 4 mo on HN
Flying Dream
 4 mo on HN
Why the world population won’t exceed 11 billion | Hans Rosling | TGS.ORG
 4 mo on HN
Hans Rosling: Debunking third-world myths with the best stats you've ever seen
 4 mo on HN
15 Sorting Algorithms in 6 Minutes
 4 mo on HN
Bret Victor - Media for Thinking the Unthinkable
 3 mo on HN
REcon 2013 - The Future of RE : Dynamic Binary Visualization (Christopher Domas)
 3 mo on HN
Bret Victor - Drawing Dynamic Visualizations
 3 mo on HN
The Known Universe by AMNH #datavisualization
 3 mo on HN
The Fallen of World War II
 3 mo on HN
I Solved Klotski
 3 mo on HN
Why are we changing maps? (from The West Wing)
 2 mo on HN
BahnMining - Pünktlichkeit ist eine Zier (David Kriesel)
 2 mo on HN
Sonification & The Problem with Making Music from Data
 2 mo on HN
Hans Rosling: Global population growth, box by box
 2 mo on HN
The Hubble Ultra Deep Field in 3D
 2 mo on HN
Gall--Peters Projection
 2 mo on HN
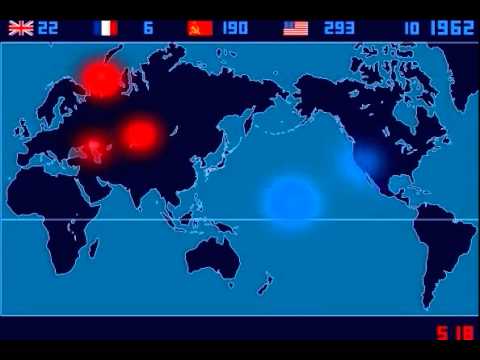
A Time-Lapse Map of Every Nuclear Explosion Since 1945 - by Isao Hashimoto
 2 mo on HN
Drawing Conclusions: Is renting really a waste of money?
 2 mo on HN
violin plots should not exist
 2 mo on HN
Google Earth’s Incredible 3D Imagery, Explained
 2 mo on HN
See how the rest of the world lives, organized by income | Anna Rosling Rönnlund
 2 mo on HN